
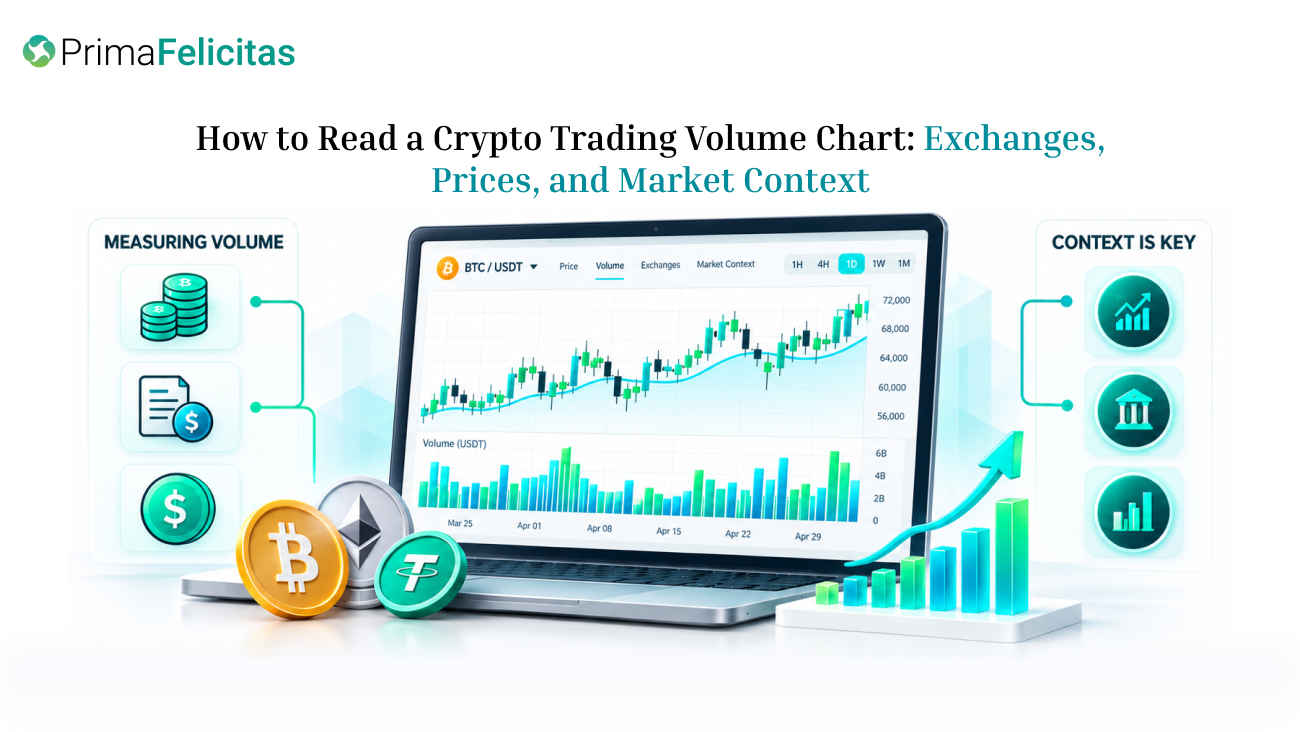
A trading volume chart shows how much reported activity occurred during each period, but it does not tell you by itself whether buyers or sellers will control the next move. The useful question is whether volume agrees with price, spreads, market breadth, and the venue where the trades occurred. When those signals diverge, the disagreement is often more informative than the headline volume number.
This guide is for crypto readers, market researchers, traders, and editors who need a practical way to interpret volume without turning it into a prediction. It explains what the bars measure, how exchange coverage changes the picture, and how to test a price move against participation. It does not recommend an asset, assign a “safe” volume threshold, or provide a trading signal.


What a Trading Volume Chart Measures
Volume is the notional value or quantity reported as traded during a defined interval. A one-hour bar may summarize executed trades between two timestamps; a daily bar may aggregate a full calendar period or a rolling window. Before interpreting a chart, check the unit, quote currency, timezone, market type, and whether the data covers one venue or several.
The chart can display volume as coins, contracts, or currency value. These measures are not interchangeable. Ten million units of a low-priced token and ten million dollars of turnover describe different things. Derivatives volume may also count contract value rather than the amount of underlying coins that changed hands. A clean-looking chart can therefore be misleading if its unit is hidden.
The first practical rule is to compare like with like. Use the same asset pair, interval, and market type when comparing two periods. If a dashboard switches from spot to perpetual futures or from USD to USDT, the apparent jump may reflect a measurement change rather than new demand.
A crypto trading volume chart can help readers see where reported activity is concentrated. It is a starting point for investigation, not a complete measure of liquidity or market quality. The chart may combine selected venues, apply filters, or refresh on a different schedule from the price feed. Record the timestamp and methodology before quoting a rank or percentage.
How Price and Volume Interact
Price and volume are separate observations. Price describes the latest agreed quote or trade; volume describes the amount reported as traded. Comparing them can reveal whether a move had more or less participation than the asset’s recent baseline, but it cannot prove intent.
Consider four simplified patterns:
| Price behavior | Volume behavior | Possible reading | What remains uncertain |
|---|---|---|---|
| Rising | Expanding | More activity is accompanying the advance | Whether buyers will remain active |
| Rising | Contracting | The move is occurring with less turnover | Whether liquidity is thin or sellers are simply inactive |
| Falling | Expanding | Risk is being repriced with active trading | Whether the move is liquidation, hedging, or new selling |
| Flat | Expanding | Heavy two-sided exchange within a range | Which side will eventually accept a worse price |
The “possible reading” column is deliberately cautious. Volume is not a vote count. Every executed trade has a buyer and a seller, and a high figure can come from position transfers, market making, arbitrage, liquidations, or short-term hedges. It shows that activity occurred, not that one narrative has won.
The baseline matters as much as the bar itself. A token that normally trades $20 million per day may look unusually active at $100 million, while $100 million may be ordinary for a large asset. Compare the current bar with the asset’s own recent range and, where relevant, with similar assets in the same market segment.
A simple example illustrates the difference. Suppose a token rises 6% while hourly turnover grows from $4 million to $18 million. That is a meaningful change in participation relative to its baseline. It still does not establish a durable trend. If the spread widens and the order book becomes shallow, the extra turnover may be the result of urgent, costly execution rather than healthy liquidity.
Why Exchange Coverage Changes the Picture
Crypto trades across many venues, so volume is never just a property of the asset. It is also a property of the exchange set being measured. One page may show a single spot pair; another may combine spot and derivatives across several jurisdictions. A third may exclude stale or low-quality feeds. Their rankings can differ while each remains internally consistent.
When reviewing crypto exchanges, separate the question “where is reported activity highest?” from “where could I execute?” A venue may rank highly by displayed turnover but be unavailable in a reader’s jurisdiction, support a different contract, or offer less depth for the exact order size under consideration. Fees, withdrawal rules, outages, and custody arrangements also affect the practical result.
Cross-venue comparison is most useful when the instruments match. Compare BTC-USD spot with BTC-USD spot before comparing it with a perpetual contract. Check whether the timestamp is synchronized and whether one source is delayed. A sudden volume spike visible on only one venue deserves a data-quality check before it becomes a market-wide claim.
Data quality can fail in several ways: duplicated trades, stale pairs, inconsistent contract multipliers, wash trading, or an aggregation rule that counts the same economic exposure more than once. None of these possibilities proves that a chart is wrong, but each is a reason to describe figures as “reported volume” rather than as verified demand.
Using Cryptocurrency Prices as a Second Check
Volume becomes more useful when paired with a clearly defined price reference. A consolidated cryptocurrency prices view can help establish the asset, quote currency, and broad market direction before you interpret one venue’s bars. It should not replace the venue-specific price that would determine an actual fill.
Look for agreement across three layers:
- Direction. Did the price move up, down, or remain in a range during the same interval as the volume change?
- Participation. Was the bar larger than the asset’s normal activity, and did the move appear across relevant venues?
- Execution conditions. Did the spread stay orderly, or did it widen as the volume increased? Is there enough visible depth for the decision being considered?
If price rises, volume expands, and spreads remain stable across multiple venues, the move has stronger descriptive support than a price spike on one thin pair. That still does not make it a forecast. If price rises while volume contracts and spreads widen, the chart may be showing a fragile quote rather than broad participation. The right conclusion is to investigate the conditions, not to assign a fixed bullish or bearish label.
The same framework applies to declines. A high-volume sell-off can reflect urgent de-risking, forced liquidation, or a temporary information shock. A low-volume decline may indicate limited interest, but it can also occur in a market with little available liquidity. Without the order-book context, the bars do not reveal which explanation is correct.
A Five-Step Volume-Chart Review
Use this routine for a research note, article, or market discussion:
- Label the chart. Write down the asset pair, spot or derivatives market, unit, interval, timezone, venues, and timestamp.
- Set a baseline. Compare the latest bars with the asset’s recent median or typical range instead of judging a single spike in isolation.
- Match the price window. Use the same start and end times for price and volume. A daily volume bar cannot explain a five-minute price move without additional data.
- Check venue and execution quality. Compare relevant exchanges, spreads, visible depth, fees, and any outages or maintenance notices.
- Write observation and inference separately. “Volume was three times the recent hourly median” is an observation. “The market is accumulating” is an inference that needs more evidence.
This process also helps editors write responsibly. Instead of saying that volume “confirmed” a rally, they can state that turnover increased alongside the move, then explain which facts support or limit that interpretation. Precision about what the chart can show is more useful than a confident but untestable label.
Limits and FAQ
Volume charts are historical summaries, not guarantees about future execution. A delayed feed can make the bar appear after the price has already moved. An index can be indicative rather than tradable. A market can have high aggregate turnover but poor liquidity at the specific size, pair, or venue a reader needs.
Financial risk is also broader than chart interpretation. Fees, slippage, leverage, liquidation rules, withdrawal limits, and local restrictions can change an outcome even when the chart is accurate. Readers should verify product terms and avoid using a volume bar as an automatic instruction to buy, sell, or increase exposure.
Does high volume mean an asset is liquid?
No. Volume measures reported turnover over a period, while liquidity concerns how much can be traded near the current quote without significant price impact. Inspect spread, order-book depth, and the relevant pair as well.
Which timeframe is best for a volume chart?
There is no universal best interval. Use the timeframe that matches the question, then compare it with a longer baseline. A five-minute chart can show an event reaction; a daily chart can show broader participation, but it may hide the sequence inside the day.
Can volume predict the next price move?
No. It can highlight unusual participation or a divergence worth investigating, but it cannot establish direction. New information, cancellations, derivatives positioning, and activity on other venues can change the market quickly.
Why do two volume charts disagree?
They may cover different exchanges, pairs, products, units, timezones, or aggregation rules. Confirm those fields before deciding that one chart is incorrect.
How should a volume spike be reported?
State the asset, venue set, unit, interval, timestamp, and comparison baseline. Use “reported volume” when the underlying data cannot be independently verified, and separate the observed spike from any explanation of why it occurred.
Conclusion
A trading volume chart is most useful when it is treated as one layer of market evidence. Start by checking its unit, interval, venue coverage, and timestamp. Then compare the bars with price direction, exchange conditions, spreads, and visible depth. Rising volume can accompany a strong move, a forced unwind, or noisy two-sided trading. The disciplined conclusion is not that volume guarantees a direction, but that it helps you ask a more precise question about participation, liquidity, and risk.
Read volume charts with context—pair activity with price, spreads, and venue data to understand participation without predicting the next move. Contact PrimaFelicitas to build transparent, data-driven crypto market analytics tools.
Views: 6