

If you are comparing crypto rankings by market cap, the short answer is that market capitalization measures relative network size, not current trading interest or short-term momentum. A large asset can rank first by market cap while a smaller token leads in 24-hour volume or percentage gain. Reading the three lists together gives a more useful picture of scale, activity, and market risk than relying on any one list.
This guide is for readers who need to explain why crypto rankings move apart. It focuses on interpretation rather than prediction. It does not recommend an asset or substitute for project, custody, or jurisdictional research.

What Crypto Rankings by Market Cap Actually Measure
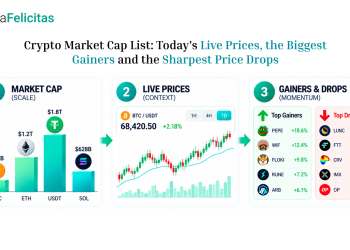
A dashboard showing crypto rankings by market cap generally uses the latest quoted price multiplied by the number of coins or tokens counted as circulating supply. In simplified form:
Market cap = price × circulating supply
That equation explains why the ranking is useful and why it can be misunderstood. It combines two variables into a single estimate of the value assigned to units considered available in the market. A token with a lower unit price can still have a larger market cap than a token with a higher price if its circulating supply is much larger.
The supply term requires attention. Data providers may differ over what counts as circulating: locked allocations, vesting contracts, bridged representations, lost coins, or treasury holdings can be treated differently. A ranking is therefore only as comparable as its supply methodology. When a project unlocks tokens, its position can change even if price moves very little.
Market cap also does not describe the amount that can be sold at the displayed price. A network may have a large estimated value but limited order-book depth, fragmented liquidity, or a small amount of genuinely active supply. Conversely, a smaller asset can trade actively for a period because a new listing, incentive program, or news event concentrates attention.
A practical first question is: What does this ranking help me compare? Market cap is most helpful for comparing relative scale within a defined universe and timestamp. It is less useful as a stand-alone statement about quality, adoption, safety, or future returns. Those judgments require evidence beyond the ranking itself.
Why Exchange Volume Can Reverse the Order
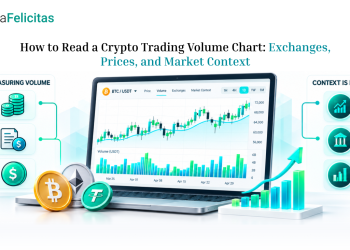
Trading volume answers a different question: how much notional value was reported as traded during a specified period. The period is often 24 hours, but the calculation may include spot markets, derivatives, or both. Some pages aggregate venues; others show a single exchange or pair. A reader should confirm the asset, quote currency, market type, time window, and aggregation method before comparing numbers.
Imagine three hypothetical assets:
| Asset | Market cap | 24h reported volume | Interpretation |
|---|---|---|---|
| Atlas | $40 billion | $900 million | Large relative scale, moderate turnover |
| Beacon | $8 billion | $2.4 billion | Smaller scale, much more active trading |
| Cedar | $1.5 billion | $650 million | Small scale, unusually high activity relative to size |
Atlas would rank first by market cap, but Beacon would rank first by reported volume. Cedar’s volume-to-market-cap ratio would look high, yet that ratio is not automatically a sign of healthy demand. It could reflect a major event, rapid portfolio rotation, derivatives activity, or unreliable reporting. The ratio is a prompt for investigation, not a verdict.
Volume can indicate whether a quoted price is supported by ongoing participation, but it does not guarantee tight spreads or deep order books at the size a reader wants to trade. One exchange can show heavy activity while another has little executable liquidity. The order book, spread, and recent fills remain relevant.
When comparing venues, a crypto exchange ranking can help organize the research question, but the label “ranking” should not be treated as a universal quality score. Check what each list measures: fees, supported markets, liquidity, geographic availability, security controls, or simply reported volume. A venue that is prominent by one criterion may be unsuitable for a reader because of local rules, product restrictions, or custody preferences.
Reported volume has data-quality limits. Wash trading, duplicated feeds, stale pairs, and inconsistent inclusion rules can distort cross-platform comparisons. It is safer to describe a number as “reported volume” and record its source and timestamp than to present it as a complete measure of real demand.
How 24-Hour Movers Change the Picture
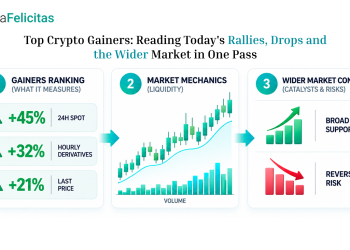
The 24-hour movers list ranks percentage price changes over a rolling or fixed window. It is a momentum snapshot, not a size table. A thinly traded token can move from $1.00 to $1.20 and appear near the top, while a much larger asset can gain 3% and remain outside the headline list.
Percentage change is sensitive to the starting point. If an asset traded unusually low during a brief sell-off, a rebound can produce a large 24-hour gain without establishing a durable trend. The same arithmetic works in reverse for the biggest decliners. A percentage move should be read alongside absolute price, volume, spread, and the event that may have caused it.
The phrase “top mover” also hides survivorship. A screen showing only the largest gainers omits assets that did not move enough to qualify, as well as tokens that rose on one venue but not across the market. A crypto biggest gainers today view is most useful as a discovery list: it tells you where to ask better questions, not what to buy.
Consider a hypothetical event. Beacon rises 18% in 24 hours on $2.4 billion of reported volume, while Atlas rises 3% on $900 million. Beacon has the stronger short-term move and more activity, but the combination still does not prove that the move will continue. A token unlock, liquidation cascade, exchange listing, or one-off headline can create large numbers that fade once the event passes.
The timing of the window matters. A 24-hour gain can cross different market sessions, a funding-rate reset, or a scheduled announcement. Comparing it with a seven-day return may reveal whether the move is a continuation, reversal, or isolated spike. Different windows should be labeled rather than blended.
A Practical Framework for Reading All Three Rankings
Use the following sequence when a dashboard shows market cap, volume, and movers side by side:
- Fix the universe and timestamp. Note whether the list covers all assets, a sector, a chain ecosystem, or a selected exchange. Record the quote currency and the time at which you read it.
- Start with market cap for scale. Identify whether the asset is large, mid-sized, or small within that universe. Check the circulating-supply definition before drawing a comparison with another provider.
- Test activity with reported volume. Ask whether the volume is spot, derivatives, or combined, and whether it is spread across several venues. Then compare the number with spreads and visible depth if execution matters.
- Use the 24-hour move as a prompt. Look for a plausible event, a change in volume, and performance over a longer window. A large percentage gain with thin depth deserves more caution than the same move with broad, persistent participation.
- Write the observation before the conclusion. For example: “Beacon is smaller by market cap, first by reported volume, and up 18% in 24 hours.” Only after recording those facts should you ask what might explain the divergence.
- Check what could invalidate the reading. Supply revisions, data outages, venue-specific activity, delayed feeds, or a market-wide shock can change the ranking quickly. If the data cannot be reconciled, treat the result as provisional.
This framework prevents a common category error: treating a list that describes scale as if it described liquidity or momentum. It also makes articles and research notes easier to audit because each claim is tied to a field, window, and source.
Limits, Risk, and the Questions Rankings Cannot Answer
Rankings are descriptive tools. They do not reveal whether a token’s code is secure, whether a project will meet its roadmap, or whether a market is appropriate for a particular reader. Market cap can be affected by uncertain supply data; volume can be inflated or fragmented; movers can be dominated by short-lived volatility.
Execution risk is separate from ranking risk. An asset may look liquid in aggregate while the relevant trading pair has a wide spread or limited depth. Fees, slippage, leverage, withdrawal limits, outages, and settlement rules can change the practical result. Readers should verify the terms of the venue available in their jurisdiction and avoid treating a screen’s ranking as a recommendation.
There is also a communication risk. Headlines that say “largest,” “most traded,” or “biggest gainer” can sound definitive even when the universe, timestamp, and methodology are omitted. A careful publisher states the measurement window, identifies whether figures are reported or independently verified, and separates an observed rank from an interpretation about why it occurred.
FAQ
Is market cap more important than trading volume?
Neither is universally more important. Market cap is useful for comparing relative scale, while volume helps describe recent activity. The right measure depends on the question: ecosystem size, execution conditions, or short-term attention.
Why can a low-market-cap token lead the gainers list?
Percentage changes are calculated from the starting price, so a smaller token can move sharply on relatively limited participation. Check volume, spread, order-book depth, and the event behind the move before treating the percentage as meaningful evidence.
Does high volume mean an asset is liquid?
Not necessarily. Volume can be concentrated in one pair, include derivatives, or reflect activity that is difficult to verify. Liquidity is about the price impact of the size you need to trade, so inspect spreads and depth as well.
How often should rankings be checked?
Use a frequency that matches the decision. A research note may need a timestamped daily snapshot, while fast-moving execution requires fresher market data. Checking more often does not fix an unclear methodology or unreliable source.
Can rankings predict the next market move?
No. They summarize past or current measurements. They can help identify an unusual relationship to investigate, but they cannot establish direction, future returns, or the probability of a specific outcome.
Conclusion
Market-cap, volume, and 24-hour mover rankings answer different questions. Market cap frames relative scale, reported volume describes recent activity, and the movers list highlights short-term price change. When the rankings disagree, that is not necessarily an error; it is information about how size, participation, and momentum are distributed. Record the universe, timestamp, definitions, and data limits before interpreting the result, and keep any investment decision separate from the ranking itself.
Understand what crypto rankings really measure—scale, activity, and momentum—before making decisions. Contact PrimaFelicitas to build data-driven analytics tools that cut through the noise.
Post Views: 76